Server keeps increasing memory use

Hello!

Today we encountered an error with our application after moving it to a new machine with different resources available to it. According to the cursory research I have done, it looks like the machine has run out of memory for the app to use. This is the error message that was printed to the screen:

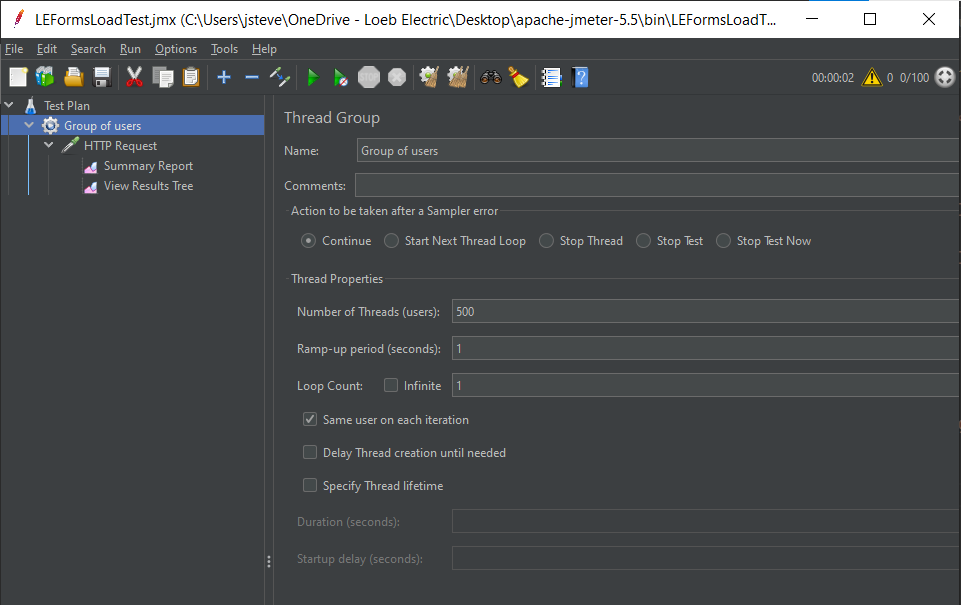
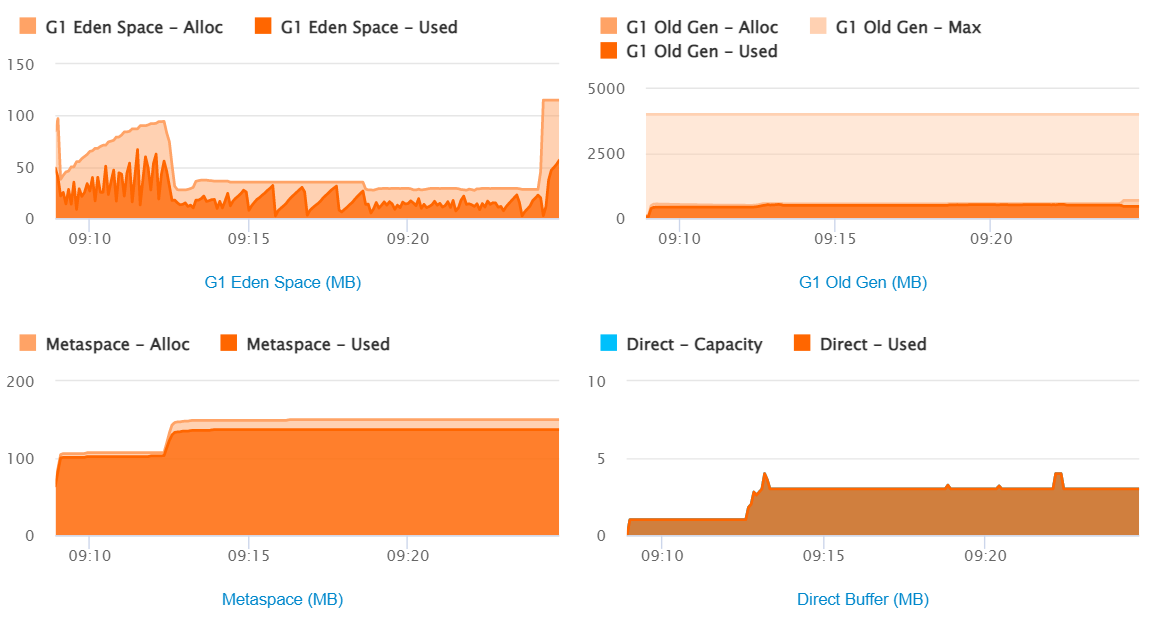
Now, I did some testing after moving back to working in my local development environment. It looks like every time I refresh the app’s homepage, it adds about 2 megabytes of memory used.

Before a lot of refreshes:


After a lot of refreshes:

My next course of action was to take a look at any of the variables or objects that might be declared by requesting this page. So, here’s the handler, layout, and view.

Handler:
I should note here, that some of the models injected here also inject one another in their own cfcs.

component {
	
	//Modules/Models
	property name = "messageBox"		inject="messageBox@cbmessagebox";
	property name = "mainHelper"		inject="mainHelper";
	property name = "sessionsHelper"	inject="sessionsHelper";
	property name = "userService"		inject="userService";
	property name = "formManagerHelper"	inject="formManagerHelper";	
	property name = "automailer"		inject="automailer";
	property name = "auth"				inject="authenticationService@cbauth";


	/**
	 * Sets the view to the root of the web application
	 */
	function index( event, rc, prc )
	{
		event.paramvalue("msg","");
		
		//These are some messages that could pop up in the index
		if(rc.msg == "invalidAuth")
		{
			messageBox.warn("It looks like you aren't authorized to do that!");
		}
		else if(rc.msg == "invalidShareToken")
		{
			messageBox.warn("This sharing link has expired or is invalid. Please get a new share link for this form.");
		}
		else if(rc.msg == "invalidAccessRequest")
		{
			messagebox.warn("The share link you tried to access had an invalid access type it tried to share with you.");
		}
		else if(rc.msg != "")
		{
			messagebox.warn("It looks like an error occurred: " & rc.msg);
		}

		//Obtain all of the names of the forms so they can be displayed on the front page
		rc.publishedForms = mainHelper.getPublishedForms();
		//Obtain the names of the top 4 most submitted forms
		rc.mostSubmittedForms = mainHelper.getMostSubmittedForms();

		event.setView( "main/index" );
	}
.
.
.
}

Layout:

<cfscript>
	variables.cbSession = new modules.cbstorages.models.SessionStorage(); //Instantiate cbStorages for Session
</cfscript>


<cfoutput>
<!DOCTYPE HTML>
<html lang="en">
<head>
	<!-- Required meta tags -->
    <meta charset="utf-8">
    <meta name="viewport" content="width=device-width, initial-scale=1, shrink-to-fit=no">

	<title>Loeb Electric Forms</title>

	<meta name="description" content="Loeb Electric Application Template">
    <meta name="author" content="Ortus Solutions, Corp">

	<!---Base URL --->
	<base href="#event.getHTMLBaseURL()#" />

	<!--- Load up bootstrap from local installation--->
	<link rel="stylesheet" href="includes/bootstrap-5.1.3-dist/css/bootstrap.css">
	<!--- Load jquery using CDN --->
	<script src="./includes/javascript/jquery-3.6.1.min.js"></script>
	<!--- Load intlTelInput --->
	<link
     rel="stylesheet"
     href="https://cdnjs.cloudflare.com/ajax/libs/intl-tel-input/17.0.8/css/intlTelInput.css"
    />
    <script src="https://cdnjs.cloudflare.com/ajax/libs/intl-tel-input/17.0.8/js/intlTelInput.min.js"></script>
	<!--- Load up style sheets for independent objects --->
	<link rel="stylesheet" href="includes/styles/switches.css">
	<link rel="stylesheet" href="includes/styles/specialButtons.css">
	<link rel="stylesheet" href="includes/styles/formattingUtilities.css">
	<link rel="stylesheet" href="includes/styles/pagination.css">
	<link rel="stylesheet" href="includes/styles/header.css">
	<link rel="stylesheet" href="includes/styles/footer.css">
	<link rel="stylesheet" href="includes/styles/formElements.css">
	<link rel="stylesheet" href="includes/styles/fileInputs.css">
	<link rel="stylesheet" href="includes/styles/formManager.css">
	<!--- Custom CSS, check for lightTheme or darkTheme setting --->
	<cfif "#variables.cbSession.exists("user")#">
		<cfif "#variables.cbSession.get("user").getSettings().theme#" == "lightTheme">
			<!--- If we are logged in and have opted for the light theme, show the light theme! --->
			<link rel="stylesheet" href="./includes/styles/baseStylesLight.css">
			<!--- Datatables light theme --->
			<link rel="stylesheet" type="text/css" href="./includes/DataTables/datatablesLight.css"/>
		<cfelseif "#variables.cbSession.get("user").getSettings().theme#" == "darkTheme">
			<!--- If we have opted for the dark theme instead, show that! --->
			<link rel="stylesheet" href="./includes/styles/baseStylesDark.css">
			<!--- Datatables dark theme --->
			<link rel="stylesheet" type="text/css" href="./includes/DataTables/datatablesDark.css"/>
		</cfif>
	<cfelse>
		<!--- If we aren't logged in, use light theme by default --->
		<link rel="stylesheet" href="./includes/styles/baseStylesLight.css">
		<link rel="stylesheet" type="text/css" href="./includes/DataTables/datatablesLight.css"/>
		<!--- <script src="https://kit.fontawesome.com/a076d05399.js" crossorigin="anonymous"></script> --->
	</cfif>
	<script type="text/javascript" src="./includes/DataTables/datatables.min.js"></script>
	
</head>
<body data-spy="scroll" data-target=".navbar" data-offset="50" style="padding-top: 0px">
	<!---Top NavBar --->
	<header id="baseHeader" role="Header">
		<div id="logoWrapper" class="wrapper">
			<!---Brand: show logo for either light or dark theme --->
			<cfif "#variables.cbSession.exists("user")#">
				<cfif "#variables.cbSession.get("user").getSettings().theme#" == "lightTheme">
					<a href="#event.buildLink("")#">
						<img class="rounded mx-auto d-block" width="150" src="includes/images/loeb-electric-logo.png" alt="logo" id ="logo"/>
					</a>
				<cfelseif "#variables.cbSession.get("user").getSettings().theme#" == "darkTheme">
					<a href="#event.buildLink("")#">
						<img class="rounded mx-auto d-block" width="150" src="includes/images/loeb-electric-logo-DARKTHEME.png" alt="logo" id="logo"/>
					</a>	
				</cfif>
			<cfelse>
				<a href="#event.buildLink("")#">
					<img class="rounded mx-auto d-block" width="150" src="includes/images/loeb-electric-logo.png" alt="logo" id="logo"/>
				</a>
			</cfif>
		</div>
		<div id="headerNav">
			<div id="navWrapper">
				<nav id="mainNav">
					<div class="navbarItem">
						<a href="#event.buildLink('')#">
							<button class="btn navbarBtn">
								Home
							</button>
						</a>
					</div>
					<div class="navbarItem">
						<a href="#event.buildLink('formManager.index')#">
							<button class="btn navbarBtn">
								Manage forms
							</button>
						</a>
					</div>
				</nav>
			</div>
		</div>
	</header>
	<!---end navbar --->

	<!--- <cfscript>
		writeDump(session)
	</cfscript> --->
	
	<!---This is messagebox!--->
	<div id="messagebox">#getInstance("messagebox@cbMessageBox").renderit()#</div>

	<!---Container for views --->
	<div id="view" class="container-full-width" >#renderView()#</div>

	<footer align="center">
		<br/>
		Copyright Loeb Electric, Inc 2023. All rights reserved.
		<br/>
		<a href="https://loebelectric.com/privacy-policy/">Privacy Policy</a> |
		<a href="https://loebelectric.com/terms-of-use/">Terms of Use</a> |
		<a href="https://loebelectric.com/wp-content/uploads/2020/06/Standard_Terms_and_Conditions.pdf">Terms and Conditions</a> |
		<a href="https://pastebin.com/AfjbMQrx">Attribution of resources</a>
	</footer>

	<!---js --->
    <!-- Bootstrap requirements: -->
	<!--- <script src="./includes/javascript/popper.min.js"></script> --->
	<script src="./includes/bootstrap-5.1.3-dist/js/bootstrap.bundle.min.js"></script>
	<!-------------------------------->
  	<script>
	$(function() {
		// activate all drop downs
		$('.dropdown-toggle').dropdown();
		// Tooltips
		$("[rel=tooltip]").tooltip();
	})
	</script>
</body>
</html>
</cfoutput>

View:

<cfoutput>

<!---
This is the main landing page and root of the site.
--->

<!DOCTYPE html>
<html>
<head>
    <title>Home</title>
</head>
<body>
    <cfif auth().isLoggedIn() AND !rc.keyExists("searchForms")>
        <div class="viewHeader">
            <h1 align="center">User Homepage</h1>
        </div>
        <!--- Show some buttons for logged in users --->
        <div id="menuView" class="container" align="center">
            <div class="row justify-content-center">
                <!---Search forms--->
                <div class="col-md-auto">
                    <a href="#event.buildLink("?searchForms=true")#">
                        <button type="button" id="button1" class="btn btn-primary dashboard-icon" data-line="true">
                            <img src="./includes/images/noun-magnifier.png" width="70px" height="70px">
                            <br>
                            Search forms
                        </button>
                    </a>
                </div>
                <!---Manage forms--->
                <div class="col-md-auto">
                    <a href="#event.buildLink("formManager.index")#">
                        <button type="button" id="button1" class="btn btn-primary dashboard-icon" data-line="true">
                            <img src="./includes/images/noun-form.png" width="70px" height="70px">
                            <br>
                            Manage forms
                        </button>
                    </a>
                </div>
                <!---User dashbaord--->
                <cfif listContains(auth().getUser().getPermissions(),"user")>
                    <div class="col-md-auto">
                        <a href="#event.buildLink(to = "user-dashboard.index", queryString = "menu=account-information")#">
                            <button type="button" id="button1" class="btn btn-primary dashboard-icon" data-line="true">
                                <img src="./includes/images/noun-user.png" width="70px" height="70px">
                                <br>
                                User dashboard
                            </button>
                        </a>
                    </div>
                </cfif>
            </div>
            <br>
            <div class="row justify-content-center" align="center">
                <!---Row 2 of dashboard icons--->
                <!---Show the button for the admin dashboard only to admins --->
                <cfif listContains(auth().getUser().getPermissions(),"admin")> 
                    <div class="col-md-auto">
                        <a href="#event.buildLink("admin-dashboard")#">
                            <button type="button" id="button1" class="btn btn-primary dashboard-icon" data-line="true">
                                <img src="./includes/images/noun-admin.png" width="70px" height="70px">
                                <br>
                                Admin dashboard
                            </button>
                        </a>
                    </div>
                </cfif>
                <!---Logout--->
                <div class="col-md-auto">
                    <form method="POST" action="#event.buildLink("logout")#">
                        <input type="hidden" name="_method" value="DELETE" />
                        <button type="submit" id="button1" class="btn btn-primary dashboard-icon" data-line="true">
                            <img src="./includes/images/noun-logout.png" width="70px" height="70px">
                            <br>
                            Logout
                        </button>
                    </form>
                </div>
            </div>
            <br>
            <div class="row justify-content-center" align="center">
                <!---Row 3 of dashboard icons--->
                <div class="col-md-auto">         
                </div>
                <div class="col-md-auto">         
                </div>
                <div class="col-md-auto">         
                </div>
            </div>
        </div>
    <cfelse>
        <!--- Show the options for users who are NOT logged in or who just want to look at forms --->
        <div class="viewHeader" align="center">
            <h1 align="center">Loeb Electric Forms</h1>
        </div>
        <cfif rc.publishedForms.recordCount() GT 0>
            <p id="homepageInstructionText" align="center">Search or select a form below</p>
            <div class="container" align="center">
                <div id="formSelectDataTableBackground"  class="datatableBackground" style="width : 75%">
                    <!----
                        Use datatables
                    ----->
                    <script>
                        $(document).ready( function () {
                            $('##formSearchTable').DataTable(
                                {
                                }
                            );
                            } );
                    </script>
                    <!---------------------->
                    <table id="formSearchTable" class="cell-border row-border compact stripe order-column">
                        <thead>
                            <tr>
                                <th>Form</th>
                                <th>Description</th>
                            </tr>
                        </thead>
                        <tbody>
                            <cfloop index="i" from="1" to="#rc.publishedForms.recordCount()#">
                                <tr>
                                    <td>
                                        <a href="#event.buildLink("main.fillout?formPK=" & rc.publishedForms.getRow(i)["FormPK"])#">
                                            <button class="openFormButton-datatable">
                                                <span>#rc.publishedForms.getRow(i)["Name"]#</span>
                                            </button>
                                        </a>
                                    </td>
                                    <td>
                                        #rc.publishedForms.getRow(i)["Description"]#
                                    </td>
                                </tr>
                            </cfloop>
                        </tbody>
                    </table>
                </div>
                <cfif rc.mostSubmittedForms.len() GT 0>
                    <br>
                    <h2>Popular forms</h2>
                    <br>
                    <!--- 
                        Show the popular forms. First, we show all of the forms that have the highest number of 
                        submissions (up to 5). If there only a few forms with submissions, we then show the next
                        available forms that have no submissions
                    --->
                    <cfset formButtonNumber = 1> 
                    <cfloop index="r" from="1" to="3">
                        <div class="row g-0 justify-content-center">
                            <cfloop index="c" from="1" to="3">
                                <cfif formButtonNumber LTE rc.mostSubmittedForms.len()>
                                    <div class="col-4">
                                        <a href="#event.buildLink("main.fillout?formPK=" & rc.mostSubmittedForms[formButtonNumber]["formPK"])#">
                                            <button class="openFormButton">
                                                #rc.mostSubmittedForms[formButtonNumber]["formName"]#
                                            </button>
                                        </a>
                                        <cfset formButtonNumber = formButtonNumber + 1>
                                    </div>
                                </cfif>
                            </cfloop>
                        </div>
                        <br/>
                    </cfloop>
                </cfif>
            </div>
        <cfelse>
            <p id="homepageInstructionText" align="center">Sorry, there are currently no forms available.</p>
        </cfif>


        <!--- Homepage buttons for registration and login, respectively --->
        <div align="center">
            
            <!--- Login with either a loeb account or a microsoft accoount w/sso --->
            
        </div>
    </cfif>
</body>
</html>

</cfoutput>

So my question to the community is, am I on the right track? Should I be looking to find instances of where models/modules/variables are declared more than they need to be if I keep adding memory usage every time the page is hit?

In addition, can anyone spot an error I’m making with the addition of more and more memory? It might have something to do with wirebox which I am not well-versed in.

The Big Question

Before you get lost in debugging, it’s worth asking: Is this really an issue?

“My app uses lots of memory” is not really a viable issue, IMHO. I accepted a while ago that Java apps (and, by extension, CFML apps) will never be the lightest in the room, but we can make up for it in power and concurrency. An OutOfMemory exception doesn’t mean you have a memory leak, it just means your app is using more memory than allotted.

My guess is that you are setting an artificially low memory limit (a newer machine with less RAM? tut tut!), then frustrating yourself when a ColdBox-on-AdobeCF-on-Java app can’t run that.

You need to install Fusion Reactor, fire up JMeter and run 100 - 500 requests against your app with up to 10 concurrent hits. Watch the memory usage. The memory should naturally go up as the app does its thing, then drop back down when the garbage collector (eventually) kicks in and does its thing. If the memory goes up rapidly with each request, never drops significantly, and tops out quite quickly with even a sizable allotted memory (I’d guess at least 2GB) then we have a problem. Until then, I’m a bit skeptic.

As one last comment… didn’t we just help you out in piping static assets through CFML? Here’s a relevant piece of my thoughts on that topic:

Note that serving images through CFML should not be done lightly. I’m thinking you’d see a dramatic decrease in image download speed, an increase in cfml/java memory usage, and an overall decrease in other page performance. (Because page rendering now has to compete with image serving for the same amount of RAM allocated to the JVM.)

So, does this homepage serve images or other assets through CFML?

Debugging Tips

So my question to the community is, am I on the right track? Should I be looking to find instances of where models/modules/variables are declared more than they need to be if I keep adding memory usage every time the page is hit?

In my (uneducated) opinion, you may be barking up the wrong tree. You’re focusing on your own code and ColdBox instantiation because it’s familiar to you, and I get it… that’s a natural tendency. But memory leaks are extremely difficult to track down, and they could be coming from anywhere in the stack. Don’t get stuck on the top 3-5 layers of CFML.

Before you get too far in the weeds with debugging your (very minimal) homepage, I would advise stepping back to see the big picture:

  1. Are there any long-running jobs or other CFML apps on this same application? Is this homepage the only CFML code running on this java instance?
  2. Do you have any .jar files or other java libraries being loaded on request or on startup?
  3. Do you have ORM enabled?
  4. Why are you only seeing this issue after changing machines?
  5. What are the resource limits we’re talking about here?
  6. Are you sure your ColdBox bootstrap code in onRequestStart() and onApplicationStart() is correct? What about the shutdown code?

These are just the vague questions I have when I see high memory usage in what looks like a basic ColdBox app (No offense intended here! :smile: ). You didn’t exactly ask for help, so I won’t bother asking for more details, like the JRE version, CF engine/version, ColdBox version, etc.

PS.

I hope this doesn’t come across as I-Know-Best… because I certainly don’t. :slight_smile: IMHO it’s much cheaper and easier to increase the RAM usage and get back to writing code/ making :moneybag::moneybag::moneybag:. Unless you have a memory leak, in which case no amount of RAM is enough! :scream: And then yes, let’s optimize the ColdBox startup as much as possible.

2 Likes

Thank you so much for the reply, Michael.

The machine we moved the app to is shared by other ColdFusion apps. Right around when those memory errors triggered, the ColdFusion administrator crashed, so I got a bit stressed out from it all :sweat_smile:

My coworker set up the app in the ColdFusion administrator, so I’ll have to meet with him to see what settings were put in place regarding the memory allocated to the JVM.

Regarding memory going up and not coming back down, that’s what appears to be happening according to the testing I did earlier. However, I recently made all of the models injected at the top of the handler singletons, as they just provide helper functions. This looks like it stopped the issue of memory continuously increasing forever on my manual refreshing of the app’s index. I’ll still have to check the other locations in the app though to see if the problem persists.

As for the image serving, this homepage isn’t serving any images or assets. Other locations in the app are, though, and I will probably have to try to optimize the locations where they are optimized. I think I might be able to do this more efficiently by showing links to serve images instead of the images themselves, just so tons of images don’t have to be served all at once in big tables.

Debugging
To answer your debugging questions:

  1. The way I saw it, it looks like there were quite a few apps set up in the ColdFusion administrator. I would assume yes. If not, I am aware that there are still lots of apps running on the same machine.
  2. There are no .jar libraries. I confirmed this by checking my lib folder and seeing it to be empty.
  3. We are not using ORM for this app, so I don’t think so.
  4. In my local environment, I don’t believe I set a cap on the amount of memory that the app can have. I am unaware how my coworker set up the app in the ColdFusion administrator.
  5. I meant RAM limit by resource limit.
  6. My local development environment has had no issues with both the onRequestStart() and onApplicationStart() methods. I am unaware of things that could be wrong with them, along with the shutdown code.

No offense taken by your response! I really appreciate your willingness to lend your experience. I’m unaware of the JRE version, but I am using Adobe@2018 for a CFEngine and I’m on Coldbox 6.

P.S.
Your response did not come across as you-know-best :slight_smile: If I’m sounding worried or do-or-die about fixing the code, that’s because it’s all I have control over at the moment and I think I may have temporarily bricked our server with this memory error :smiling_face_with_tear:.

1 Like

Hi Michael,

Here are the results of my load testing using JMeter…

First, here’s what my test looks like. I’m just hitting the homepage with 500 different users.

Server memory before the test:

Server memory after the test:

Server memory 20 minutes after the test (the session lifespan):

So it looks like on the end of a session, garbage collection comes in and does its thing. However, is it normal to just keep having the memory usage go up when a single user keeps hitting the same page? Just want to be sure I’m covering all my bases for potential problems.

Don’t use the Windows Task Manager to monitor the actual memory in use by the JVM. That’s like measuring the outside of your fridge to guess how much milk you have left. (you actually have half a gallon, but it expired last Tuesday :laughing: )

If you believe there is a memory leak (and the metaspace errors does seem to imply that), then the first step is to install FusionReactor. If you don’t have FR, you are really wasting your time every test you do while just looking at the task manager. All that shows you is how much total memory is allocated to Java, but not how big the heap is, nor how much of that heap is used, nor how much is used by each memory space, nor how much garbage collection is reclaiming, etc, etc.

It’s normal for Java to spike memory usage under load and then free most of it up later, but once an operating system has given an amount of RAM to a process, it generally doesn’t “take it back”, so just because Task Manger shows a larger amount of RAM doesn’t really tell us anything other than Java was using that at some point in time. The real question is what memory spaces are not being collected.

Let us know when FR is installed on the box, and I can direct you where to start collection data inside the FR web UI.

1 Like

@bdw429s I’m curious… how strong is that implication? Is a “metaspace” error different than an OOM exception?

1 Like

I’m not sure what you’re asking, but the error message he provided literally said the metaspace ran out of memory, so it’s pretty clear.

image

No, in this case it’s the specific type of OOM he received. The JVM has many memory “spaces”, and any of them can fill up, the metaspace is one of them.

Just wanted to reply to a couple other questions @Jeff_Stevens had asked that I didn’t address prior (and this is in addition to everything Michael has already laid out :slight_smile: )

This shouldn’t cause a memory leak, but this is wasteful and unecessary. The sessionStorage object is a singleton façade that you shouldn’t be creating manually. If you want it, just ask WireBox for the instance.

cbSession = getInstance( 'SessionStorage@cbstorages' )

It’s fairly difficult to create a metaspace memory leak with CFML. Metaspace is where things like classes and Threads live. You can create all the variables you like, but so long as they ultimately live in the request, local, or arguments scopes of your page, they will all be cleaned up (eventually) at the end of the request.

TBH, if there is a metaspace leak, it’s probalby not your fault. Things to look into:

  • What version of ColdBox are you on?
  • Did you recently upgrade ColdBox
  • Are you reinitting the ColdBox framework on every request?

Thanks for the tip! I thought I could get away with just using the task manager, but it looks like Fusion Reactor is the standard for working with issues like this.

I now have Fusion Reactor installed on my server via commandbox and I’m going to repeat my tests with JMeter. If you have anything you want me to directly take a look at I’m all ears :slight_smile:

Also!

Thanks for the tip on the instantiation of that cbSession. I ought to change occurrences of that now.

As for what may cause a metaspace leak, I do use ajax requests that may have not been fully cleaned up, and I have used the variables scope to create hold objects within my handlers and views.

  • I am on Coldbox 6.8.1+5
  • I have not recently upgraded Coldbox
  • I am not reiniting the framework on every request. At least I don’t think so. I’ve never made an effort to do so.

Yes, the first bit is the memory usage graph on the “Metrics” > “Web Metrics” dashboard
image

This doesn’t tell you everything about the heap, but it’s a good overview. There are three different series being plotted

  • the max heap configure for the JVM
  • the actual amount of heap currently allocated to the JVM
  • the used heap which actually has stuff in it

It’s normal for the heap to climb while there is traffic (garbage collection is lazy) but once traffic has subsided, if you click the “Garbage Collection” button under the CPU graph (which is under the memory graph) and the heap goes down significantly, then that is fine.

The second place to keep an eye on is “Resources” > “Memory Overview”.

This page has a TON of graphs that map to all the memory spaces that Java is using. Metaspace is one of them. Use this page to see which spaces are growing and never coming back down. And specifically, if every request adds memory, see which space its getting added to. Note, variables can be shifted around in memory so temp variables used by a request start in a young gen space, and may be moved to an old gen space if they live long enough, etc.

That’s not really a thing. Any variable you create in a variables (in a .cfm like a view or a layout), request, arguments, or local scope first of all is never stored in the metaspace. It’s usually never going to make it out of a young gen space and once the request is finished, all references to those variables should be removed, and the next garbage collection will remove them from memory entirely. Now, it is possible for you to create things like session or application variables that live for a long time, but those will end up in an old gen space, not the metaspace.

This may or may not be an issue-- There’s nothing wrong with injecting things like a service into a handler’s variables scope, but no request-specific data should ever go in the variables scope as handlers are singletons and only one instance of them exists, servicing all page requests. If you’re placing data specific to single user or request in the variables scope of a handler, this can cause race conditions and leak data across page requests, but will not necessarily be a memory leak unless you’re creating an unbounded number of uniquely-named variables. And even if that were the case, it wouldn’t use the metaspace.

Thanks for your time on helping to diagnose this, Brad. Here’s the results of my following your directions:

Heap
Here’s what the heap looks like after the server has been on for about 10 minutes and has taken several requests from myself:
image

Now, here’s a closer look at the the heap during a load test where the index of the site is hit once by 500 different simulated users:
image

Here’s the result of clicking the garbage collection button:
image

My gut tells me that the problem doesn’t seem to be with the heap here, but I’m curious to hear your analysis.

Memory Overview
Here’s the impact of running the 500 user load test on several of the metrics on the memory overview page.

Now, I ran the 500 user load test 3 more times to see if I could pressure the server into allocating more memory:

The same metrics after running garbage collection. Not much seems to have changed:

So it does look to be that the metaspace isn’t going back down here. With this understanding of the metaspace, it looks like I’m potentially creating class objects during requests that aren’t getting binned when they should be.

EDIT:

Now that I think about it, if I kept hitting the same page more with the same request and the metaspace stays constant, I think I don’t have much of a problem? Perhaps the handler, on being hit, instantiated all of its singleton classes (all the injections at the top) and now those are just hanging out in the metaspace?

It’s also worth mentioning that I just this morning added extends="coldbox.system.EventHandler" to all my handlers, as I thought the memory issue may have originated from the constant re-instantiation of cfcs that Coldbox didn’t know were handlers, and therefore didn’t know to treat them as singletons.

Those memory graphs all look pretty normal to me. I would recommend running your test until you receive the out of memory error.

This literally makes no sense :slight_smile: It is not necessary to explicitly extend the base event handler, nor does it have any affect on memory, nor does it cause ColdBox to re-create anything, nor does it affect their singleton status. And even if ColdBox did re-create them, it wouldn’t cause a memory leak.

This is a pretty big piece of information. Especially since earlier you were saying every hit to the site increased the memory usage.

It’s also worth mentioning, your memory issues may not be reproducible via a load test. Many times, issues can arise from your application timeout (which defaults to every day) and is more of a slow death every time the framework reinits if stuff doesn’t get cleaned up. Speaking of, I’d ensure your application timeout is set to like, forever, to help avoid this.

Metaspace doesn’t typically go back down. It’s used to store stuff which usually lives forever such as classes and threads. What it should do on a healthy app is grow to where it needs to be and then stay stable, but you’ll never see it dip way down near zero like the normal heap does after a GC.

I doubt you’re doing it directly unless you’ve got something like Javaloader in the mix (which can create a class loader leak pretty easily). It’s worth noting a Java Class is not the same as a Java object instance (CFML has no equivalent of a class as an object itself). You can create thousands upon thousands of object instances but never load a new Class definition from a class loader. So there’s no CFML code you will normally write that explicitly loads a class into metaspace. That’s something that’s done behind the scenes, and normally done once. All instances are then created from that class definition.

Let me give you something else to keep an eye on while testing. I actually think there may be a chance your leak is related to threads more than it is classes. In FR, look under “Resources” > “Thread State” and keep an eye on the total number of threads on the JVM. There are lots of reasons threads can be created, and it’s not uncommon to have several hundred of them, but if the total number of threads seems to grow without end, that can be a sign too. There are several other pages in FR which show you more info about what threads are doing, but this page is probably the easiest one for just tracking the total number over time.

1 Like

Good to hear that the memory graphs look normal!

Thanks for clearing this up. I was worried that this might have been happening.

It looks like during the load testing (which was ultimately several thousand users accessing a single page), the metaspace increased about 5-10 megabytes and then stayed constant. It hasn’t gone back down since, but manually hitting other handlers that have not yet been hit since starting the app seems to have a much stronger effect on the metaspace increasing than the consistent access of a single handler.

I do currently not have the application timeout set in my application.cfc. Should I put something like:

this.applicationTimeout    = createTimespan( 9001, 0, 0, 0);

In my application.cfc?

This is what my thread state page looks like for today. You can see earlier in the day when I did the load testing. It looks like the number of threads hasn’t gone back down in the same way that your graph shows. Could this be an issue?

Yes. By default, Lucee’s app timeout is one day which means ColdBox is re-created ever day and the current ColdBox boilerplates don’t make use of any onApplicationEnd sort of tear down stuff so far as I know. I can’t say that’s related to your issue, but it’s good advice regardless.

There’s nothing wrong with that graph per se. Again, you need to run your test until you get the out of memory error. Just looking graphs under normal server operation isn’t going to tell you a lot. If you run your server until you get another metaspace OOM and the number of threads increases to some huge number (thousands), then maybe we have something. But just because you looked now and there are a reasonable number of threads at this minute doesn’t necessarily tell us anything.

1 Like

Got it. Okay, thank you so much for your time and experience here, Brad.

My coworker Gary is going to set up a test environment on a Hostek server that will attempt to recreate the conditions for the environment where it originally threw the error. Once we have that set up, I’ll be trying out some load testing there.

I’ll come back with some results ASAP :slight_smile:

1 Like

@Jeff_Stevens, I’m coming in late, of course, but I’d like to offer a different take on the issue: just a minute to read and not much more to perhaps solve this for you.

I see Michael and Brad have offered a lot of great insight that may help you and others, but one thing I’ve not seen discussed yet is simply what you have set (if anything) as your maxmetaspacesize in your jvm args (for the machine that had the error).

I can understand how the focus here has been on why metaspace is rising, what might impact it, etc, but solving this could be as simple as just removing the maxmetaspacesize arg in that original server. Let me explain.

You’ve not mentioned what cf version you’re running, but your stack trace showed reference to cf (rather than lucee), and until cf2021 Adobe did set a maxmetaspacesize by default (or set it to the maxpermsize if it was there). They no longer do, thankfully…though they WILL migrate it in if set in an earlier version if on the same machine. Or you could have imported prior jvm settings. (The Tomcat config underlying Lucee does not set it by default, nor does Commandbox. And am I reading things right, that you have been doing this testing in Commandbox rather than on the original server?)

To be clear, if there is no maxmetaspacesize set, the jvm takes it from available OS memory…and I’ve rarely seen any cfml app need more than a few hundred meg, so it’s just not necessary to “chase the rabbit” of finding a “good max size”. Just remove it.

For more on all this (especially from a CF perspective), including the connection to the old maxpermsize, and why just removing it makes sense for most situations, see a couple of blog posts I did on the topic (first a brief one then an elaborated one):

But really, you can forego that: just look at the jvm args on that original server. Or if FR is there, look at the metaspace memory graph to see if it shows a max value. (Note that the graphs above show no max at all for that metaspacr graph, which tells us those are from a cf or lucee that has no maxmetaspacesize set.)

If your max is in the hundreds of megs, just remove it. (You can watch it in fr or using cfml that calls upon Java to track it, if you may still fear it rising.)

Let us know what you think or how it goes. And here’s hoping this oom error may be out of YOUR memory soon. :slight_smile:

2 Likes

Hi Charlie,

Thanks so much for contributing here.

So that’s something I think may have been set up on the production server that I was unaware of when my coworker was pushing the app to production. I’ll have to ask him about that.

I’m on Adobe@2018

The graphs in this thread were recorded from the app running on my local machine. I don’t believe I set a max metaspace variable, as I’m just running on localhost from commandbox.

I appreciate the input :slight_smile: I’ll be asking my coworker about potentially removing any max metaspace variables he may have set up for the app, but I believe we’re still going to run a stress test on a staging server to check for potential memory leaks. I assume we’re not going to find much, but I’m interested in what might come of it.

1 Like

Jeff, just thought I’d check in now a year on. How did things turn out?